
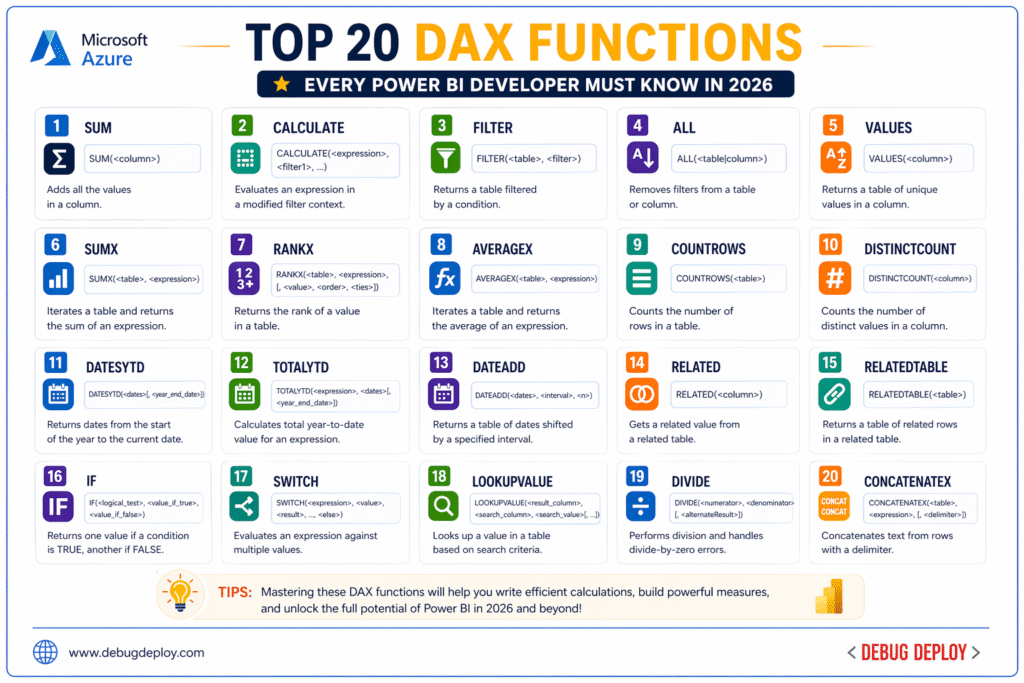
Data Analysis Expressions (DAX) is the core language behind advanced analytics in Power BI. It allows developers and data analysts to create powerful calculations, build dynamic reports, and generate meaningful business insights from raw data. Whether you are working on dashboards, KPIs, or complex financial models, DAX plays a critical role in transforming data into decision-making intelligence. As businesses increasingly rely on data in 2026, mastering DAX has become an essential skill for anyone working with Power BI.
DAX is primarily used to create measures, calculated columns, and calculated tables. While it may seem complex at first, understanding a set of core functions can help you solve most real-world problems efficiently. Below are the top 20 DAX functions every Power BI developer should know, along with their importance in practical scenarios.
1. SUM
Adds values in a column.
Formula:
Total Sales = SUM(Sales[Amount])
Use Case: Total sales calculation
SUM is one of the most basic aggregation functions. It adds all values in a column and is commonly used to calculate totals such as revenue, sales, or quantity.
2. AVERAGE
Calculates the average of a column.
Formula:
Average Sales = AVERAGE(Sales[Amount])
Use Case: Average sales amount
AVERAGE calculates the mean of a column. It is useful for KPIs like average sales per customer, average order value, or performance metrics.
3. COUNT
Counts numeric values.
Formula:
Order Count = COUNT(Sales[OrderID])
Use Case: Number of orders
COUNT returns the number of numeric values in a column. It helps track how many valid entries exist in a dataset.
4. COUNTA
Counts non-empty values.
Formula:
Customer Count = COUNTA(Sales[CustomerName])
Use Case: Count customer names entered
COUNTA counts all non-empty values, including text and numbers. It is useful when working with mixed data types.
5. DISTINCTCOUNT
Counts unique values.
Formula:
Unique Customers = DISTINCTCOUNT(Sales[CustomerID])
Use Case: Unique customer count
DISTINCTCOUNT returns the number of unique values in a column. This is commonly used for counting unique customers, products, or transactions.
6. CALCULATE
The most powerful DAX function.
Use Case: Modify filter context.
Formula:
West Sales = CALCULATE([Total Sales], Sales[Region] = “West”)
Use Case: Region-wise sales calculation
CALCULATE is the most powerful and important DAX function. It modifies the filter context and performs calculations based on specific conditions. Almost all advanced DAX formulas use CALCULATE.
For example, you can calculate total sales for a specific region or year using filters inside CALCULATE.
7. FILTER
Returns filtered table data.
Formula:
High Sales =
CALCULATE([Total Sales],
FILTER(Sales, Sales[Amount] > 10000))
Use Case: High-value sales only
FILTER returns a table that meets certain conditions. It is often used with CALCULATE to apply complex filtering logic.
8. ALL
Removes filters from a table or column.
Formula:
Grand Total =
CALCULATE([Total Sales], ALL(Sales))
Use Case: Ignore slicer filters
ALL removes filters from a table or column. It is useful when you want to calculate totals or percentages without the influence of filters applied in visuals.
9. SUMX
Formula:
Total Revenue = SUMX(Sales, Sales[Quantity] * Sales[Price])
Use Case: Calculate total revenue using quantity × price
SUMX is an iterator function. It evaluates an expression for each row in a table and then sums the results. It is useful for calculations like total revenue based on quantity multiplied by price.
10. COUNTROWS
Counts the number of rows in a table.
Formula:
Total Orders = COUNTROWS(Sales)
Use Case: Count total number of transactions
COUNTROWS counts the number of rows in a table. It is often used with filtered tables to count specific records.
11. RELATED
Fetches data from related tables.
Formula:
Category =
RELATED(Products[Category])
Use Case: Fetch product category
RELATED retrieves values from another table based on relationships. It is essential for working with multiple tables in a data model.
12. VALUES
Returns unique values from a column.
Formula:
Unique Products = VALUES(Sales[Product])
Use Case: Distinct product list
VALUES returns a distinct list of values from a column. It is useful for creating dynamic calculations and filtering unique items.
13. IF
Performs conditional logic.
Formula:
Status = IF([Total Sales] > 50000, “Achieved”, “Pending”)
Use Case: Check sales target status
IF is a logical function used to apply conditions. It returns different results based on whether a condition is true or false.
For example, categorizing sales as “High” or “Low” based on a threshold.
14. SWITCH
Handles multiple conditions efficiently.
Formula:
Grade = SWITCH(TRUE(),
[Score] >= 90, “A”,
[Score] >= 75, “B”,
“C”)
Use Case: Grade classification
SWITCH is used for multiple conditions and is cleaner than nested IF statements. It improves readability in complex logic.
15. RANKX
Fetches data from related tables.
Formula:
Category =
RELATED(Products[Category])
Use Case: Fetch product category
RANKX ranks values in a table based on a specified expression. It is commonly used for ranking products, customers, or regions by sales.
16. CONCATENATE
Combines text values into a single string.
Formula:
Full Name = CONCATENATE(Users[FirstName], Users[LastName])
Use Case: Combine first and last names
CONCATENATE combines text values. It is useful when creating full names, labels, or custom text fields.
17. FORMAT
Converts values into a specific format.
Formula:
Formatted Sales = FORMAT([Total Sales], “₹#,##0”)
Use Case: Display sales in currency format
FORMAT converts numbers into a specific format such as currency, percentage, or date. It improves the presentation of data in reports.
18. DATE
Creates a date value from year, month, and day.
Formula:
Start Date = DATE(2026, 4, 30)
Use Case: Create custom date values
DATE creates a date value using year, month, and day. It is useful for building date tables and performing time-based calculations.
19. SAMEPERIODLASTYEAR
Compare data with last year.
Formula:
Last Year Sales =
CALCULATE([Total Sales],
SAMEPERIODLASTYEAR(Dates[Date]))
Use Case: Compare with previous year
This is a time intelligence function used to compare current performance with the same period in the previous year. It is widely used in financial and business reporting.
20. TOTALYTD
Formula:
YTD Sales =
TOTALYTD([Total Sales], Dates[Date])
Use Case: Year-to-date sales
TOTALYTD calculates year-to-date values. It is essential for tracking cumulative performance such as total sales or revenue throughout the year
People Also Ask
What is the most important DAX function?
CALCULATE is considered the most powerful and essential function.
Is DAX difficult to learn?
It can be challenging initially, but practice makes it easier.
How many DAX functions should I learn?
Start with the top 20–30 functions to build a strong foundation.
Do I need DAX for Power BI?
Yes, DAX is essential for advanced data analysis.
What is the difference between DAX and Excel formulas?
DAX focuses on data models and relationships, while Excel formulas work on individual cells.
Real-World Example
Example Scenario
Goal: Build a sales dashboard
Use SUM for total sales
Use CALCULATE for filtered insights
Use TOTALYTD for yearly performance
Result: Dynamic and interactive Power BI dashboard
Related Reports
- How Power BI Drives Smarter Data-Driven Decisions
- Transitioning Your Data Workflow from Excel to Power BI
- What Is Microsoft Azure? 7 Powerful Reasons Beginners Should Care About Cloud Computing
- What Is Power BI? A Complete Beginner’s Guide (2026)
Conclusion
Mastering the top DAX functions every Power BI developer must know is key to unlocking the full potential of Power BI.
Final Takeaways
Start with core functions like SUM and CALCULATE
Focus on filter and time intelligence functions
Practice with real-world datasets
Career Insight
Strong DAX skills can significantly boost your career as a Power BI Developer or Data Analyst.
Want to Get Certified in Power BI?
Get trained by a Microsoft Certified Trainer (MCT) and master the skills every Power BI professional needs in 2026.
Recommended certification program:
PL-300T00-A: Microsoft Power BI Data Analyst
✅ Live Instructor-Led Training
✅ Hands-On Power BI Labs
✅ DAX Functions & Formula Mastery
✅ Data Modeling & Power Query Practice
✅ Real-World Dashboard Scenarios
✅ Certification Exam Guidance
📧 Email us: trainings@debugdeploy.com
📱 WhatsApp us for quick assistance
Start your Power BI certification journey today and become an in-demand BI professional in 2026!