
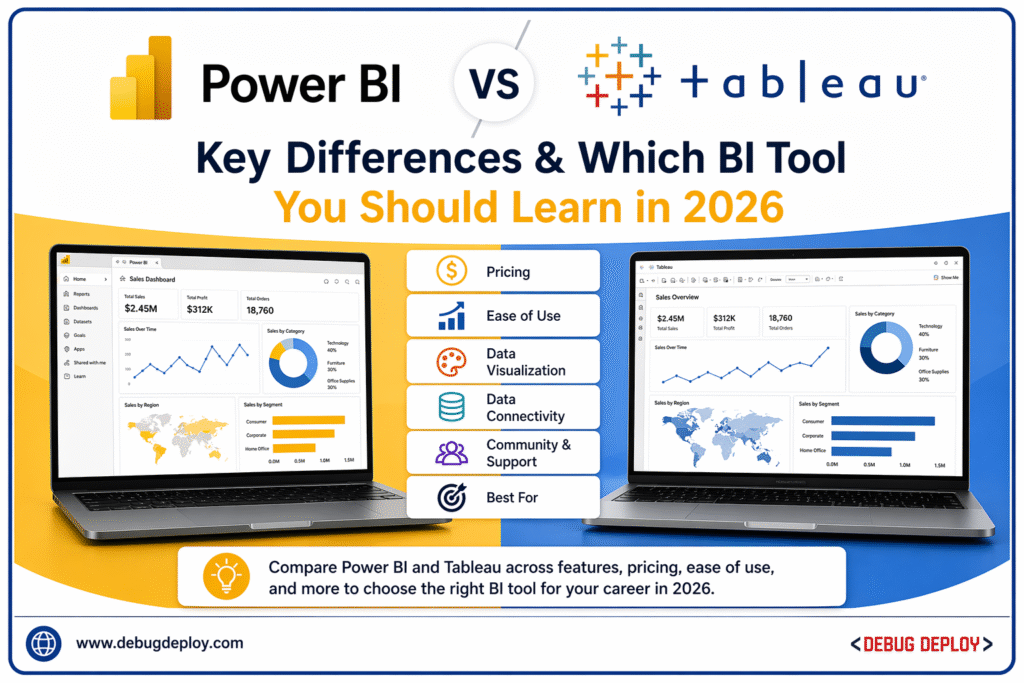
Data visualization and business intelligence (BI) tools have become essential for organizations that want to turn data into actionable insights. Among the most popular tools in this space are Microsoft Power BI and Tableau. Both platforms help users analyze data, create dashboards, and support decision-making, but they differ in pricing, ease of use, performance, and ecosystem. If you are planning to build a career in data analytics in 2026, choosing the right tool can give you a strong advantage.
What Is Power BI?
Power BI is a business analytics tool developed by Microsoft that allows users to visualize data, create interactive dashboards, and generate reports. It integrates deeply with Microsoft products such as Excel, Azure, and Microsoft 365, making it highly popular among enterprises already using the Microsoft ecosystem. Power BI is known for its affordability, ease of learning, and strong data modeling capabilities.
What Is Tableau?
Tableau is a leading data visualization tool developed by Salesforce. It is widely known for its powerful visual analytics, intuitive drag-and-drop interface, and ability to handle complex data visualizations. Tableau is often preferred by organizations that prioritize advanced visual storytelling and flexible data exploration.
Key Difference: Ease of Learning
Power BI is generally easier for beginners, especially those familiar with Excel or Microsoft tools. Its interface feels intuitive, and learning resources are widely available.
Tableau also has a user-friendly interface but may take slightly longer to master when working with advanced visualizations and data structures.
If you are completely new to data analytics, Power BI often provides a smoother starting experience.
Data Handling and Performance
Power BI performs well with structured data and integrates efficiently with Microsoft databases and services. It uses a strong data modeling engine and supports DAX for calculations.
Tableau is known for handling large datasets and complex data sources more efficiently in some scenarios. It excels in real-time data analysis and flexible querying.
Visualization Capabilities
Tableau is often considered superior in terms of advanced and highly customized visualizations. It allows users to create complex and visually rich dashboards with greater flexibility.
Power BI offers strong visualization features as well, but it focuses more on business-friendly dashboards and ease of use rather than extreme customization.
If your focus is storytelling and advanced visuals, Tableau may have an edge.
Pricing Comparison
Power BI is significantly more affordable, especially for individuals and small businesses. It offers a free version and low-cost subscription plans.
Tableau is generally more expensive, which can be a factor for beginners or small organizations.
Because of its pricing advantage, Power BI is widely adopted in startups and mid-sized businesse.
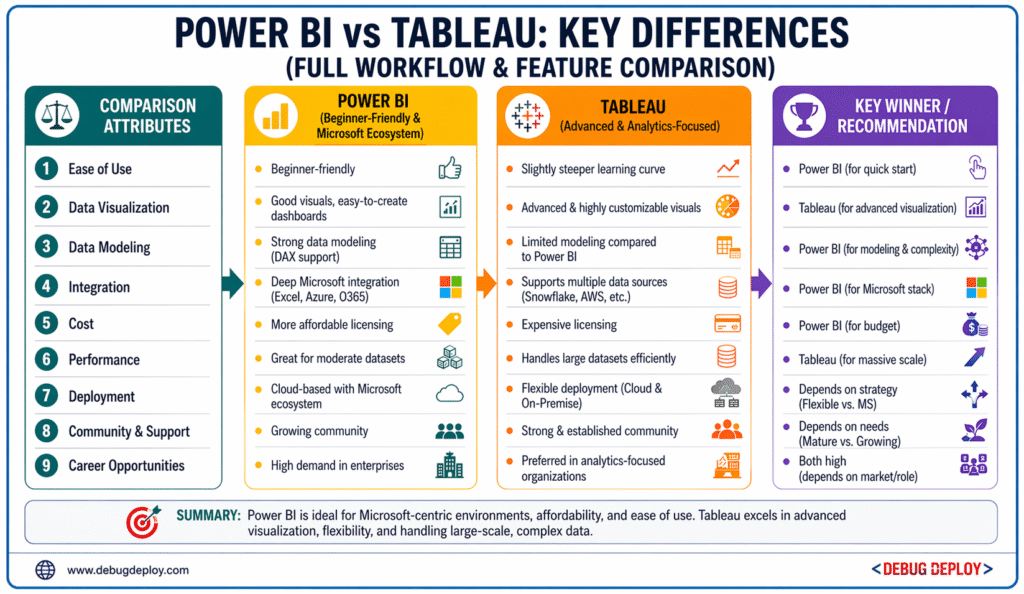
Comparison Table
Feature | Power BI | Tableau |
Ease of Use | Easy | Moderate |
Visualization | Good | Excellent |
Data Modeling | Strong | Moderate |
Cost | Low | High |
Performance | Good | Excellent |
Integration and Ecosystem
Power BI integrates seamlessly with Microsoft tools such as Excel, Azure, SQL Server, Teams, and SharePoint. This makes it ideal for organizations already using Microsoft products.
Tableau integrates well with various data sources and third-party platforms. It is platform-independent and works across different environments.
Your choice may depend on the ecosystem you are already working in.
Data Modeling and Calculations
Power BI uses DAX (Data Analysis Expressions), which is powerful but requires practice to master. It is highly effective for building complex calculations and business logic.
Tableau uses its own calculation language and focuses more on visualization-driven analysis.
Power BI is often stronger in data modeling, while Tableau focuses more on data exploration.
Deployment and Sharing
Power BI allows easy sharing of reports through Power BI Service, dashboards, and Microsoft Teams integration.
Tableau offers Tableau Server and Tableau Online for sharing and collaboration.
Both tools support cloud-based and enterprise-level deployments.
Career Opportunities
Both Power BI and Tableau offer strong career opportunities.
Power BI is widely used in corporate environments, especially companies using Microsoft technologies. It is in high demand for roles such as Data Analyst, BI Developer, and Reporting Analyst.
Tableau is popular in data-focused companies, consulting firms, and organizations that prioritize advanced analytics and visualization.
In many job markets, Power BI demand is growing faster due to its affordability and Microsoft ecosystem.
Which One Should You Learn?
Choose Power BI if:
- You are a beginner in data analytics
- You want an easy-to-learn tool
- You already use Microsoft tools like Excel
- You want a cost-effective solution
- You are targeting corporate or enterprise jobs
Choose Tableau if:
- You want advanced data visualization skills
- You work with complex or large datasets
- You are interested in data storytelling
- You plan to work in analytics-heavy or consulting roles
Can You Learn Both?
Yes, many professionals learn both tools. The core concepts of data analysis, visualization, and reporting remain similar. Once you understand one tool, learning the other becomes easier.
People Also Ask
Which is better, Power BI or Tableau?
It depends on your goals—Power BI for beginners and cost efficiency, Tableau for advanced visualization.
Is Power BI enough to get a job?
Yes, many companies hire Power BI professionals.
Can I learn both tools?
Yes, learning both gives you a competitive advantage.
Which tool is in higher demand in 2026?
Power BI is expected to grow faster due to Microsoft ecosystem adoption.
Is Tableau harder than Power BI?
Yes, Tableau has a steeper learning curve compared to Power BI.
Real-World Example
Example Scenario
Goal: Create a business dashboard
Power BI → Easy integration with Excel and quick reporting
Tableau → Advanced visualization and storytelling
Result: Both tools deliver insights, but with different strengths
Related Reports
- How Power BI Drives Smarter Data-Driven Decisions
- Transitioning Your Data Workflow from Excel to Power BI
- What Is Microsoft Azure? 7 Powerful Reasons Beginners Should Care About Cloud Computing
- What Is Power BI? A Complete Beginner’s Guide (2026)
Conclusion
The choice between Power BI vs Tableau depends on your career goals, budget, and technical needs.
Final Takeaways
- Power BI → Best for beginners and business users
- Tableau → Best for advanced visualization
- Learning both tools provides maximum career flexibility
Career Insight
In 2026, professionals who understand both data modeling and visualization tools will have a strong competitive edge.
Want to Get Certified in Business Intelligence?
Get trained by a Microsoft Certified Trainer (MCT) and build in-demand skills in data analytics, dashboards, and reporting.
Recommended certification program:
PL-300T00-A: Microsoft Power BI Data Analyst
✅ Live Instructor-Led Training
✅ Hands-On Power BI Labs
✅ Interactive Dashboards & Reports
✅ Power Query, DAX & Data Modeling
✅ Real-World BI Scenarios
✅ Certification Exam Guidance
📧 Email us: trainings@debugdeploy.com
📱 WhatsApp us for quick assistance
Start your Business Intelligence journey today and become a job-ready data professional in 2026!