
Introduction
Most novices concentrate on making charts, dashboards, and visualizations while developing reports with Power BI. However, seasoned Power BI experts are aware that the data model is the cornerstone of each high-performing report.
A well-designed data model increases scalability, streamlines computations, boosts report performance, and clarifies data. However, a badly designed model might result in complicated maintenance, delayed reports, and erroneous results.
Whether to use a Flat Table or Star Schema approach is one of the most frequently asked questions among Power BI users. Both approaches can be effective, but they have different uses and benefits.
In this guide, we’ll explain what a data model is, why it matters in Power BI, and compare Star Schema vs Flat Table to help you choose the right approach for your reporting projects.
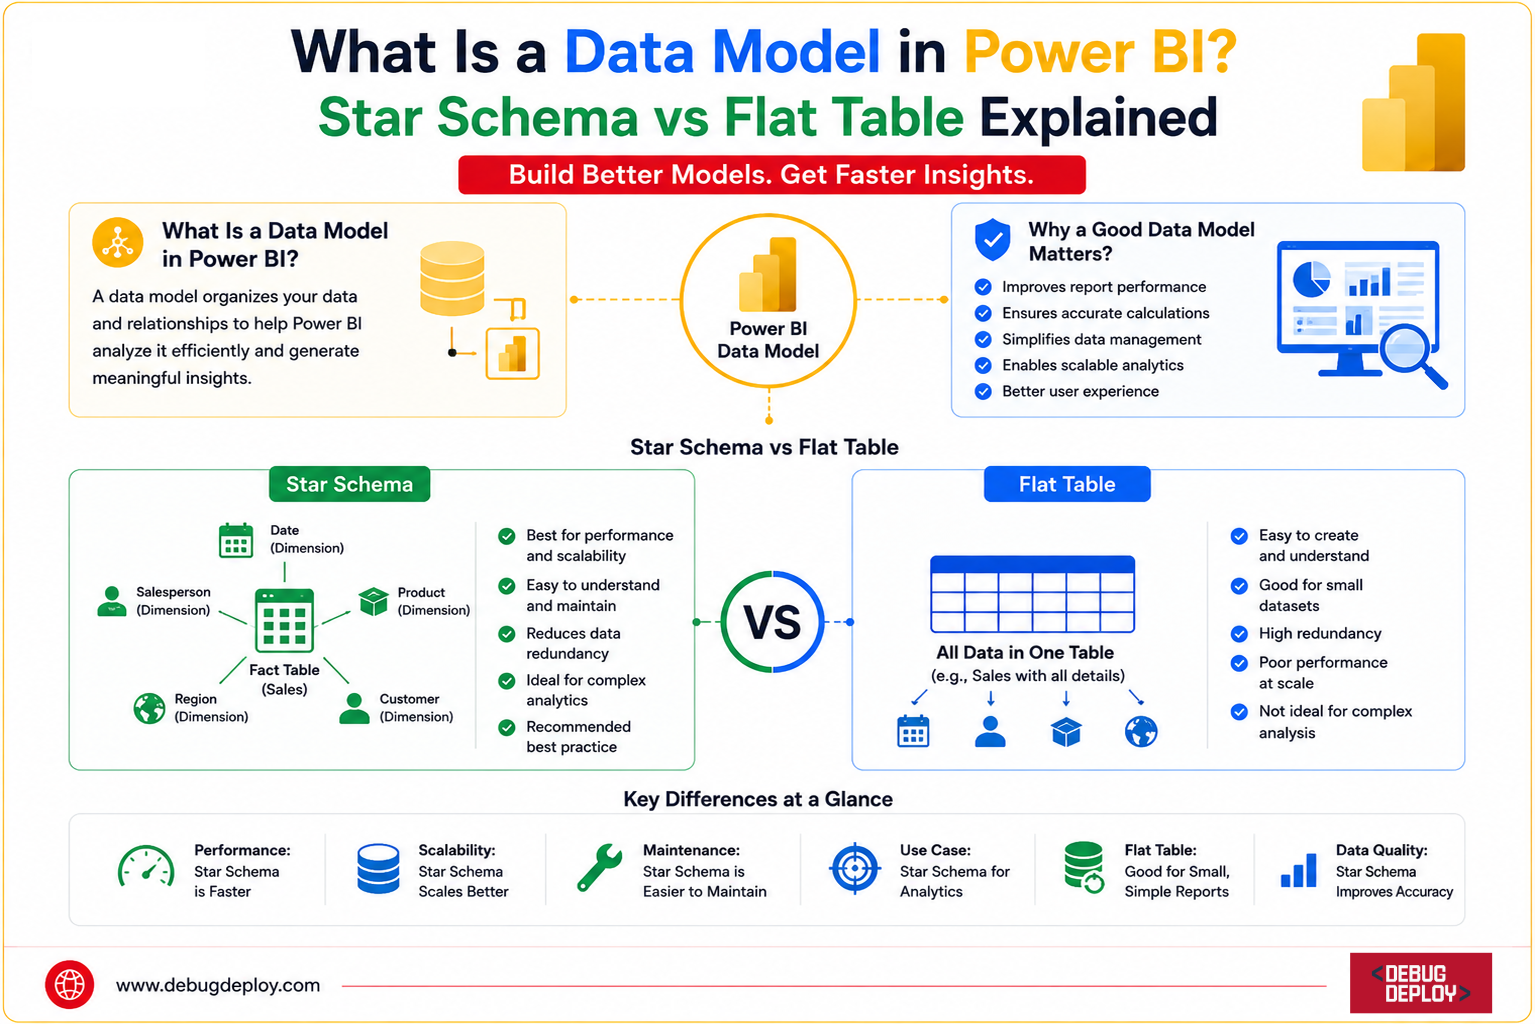
What Is a Data Model in Power BI?
The framework that specifies how data is arranged and connected in Power BI is called a data model.
It serves as the framework for establishing relationships, joining tables, and facilitating computations across datasets.
Consider a data model as your reporting system’s blueprint. It establishes the effectiveness with which Power BI can retrieve, process, and display data.
A typical Power BI data model contains:
Fact tables
Dimension tables
Relationships
Measures
Calculated columns
Hierarchies
The quality of your data model directly impacts report performance and usability.
Why Is Data Modeling Important?
Many Power BI users initially load data into reports and begin creating visuals immediately. While this may work for small datasets, it often causes problems as data grows.
A strong data model provides several benefits:
Improved Performance
Well-structured models process queries faster and reduce report load times.
Simplified Reporting
Users can easily understand data relationships and create visuals without confusion.
Better Scalability
As datasets grow, properly designed models remain manageable and efficient.
Easier Maintenance
Changes to data sources and business rules become easier to implement.
Accurate Calculations
Relationships ensure measures and KPIs produce reliable results.
For enterprise reporting environments, data modeling is one of the most important Power BI skills.
Understanding Fact and Dimension Tables
Before comparing Star Schema and Flat Tables, it’s important to understand two key concepts.
Fact Tables
Fact tables contain measurable business data.
Examples include:
Sales transactions
Revenue
Orders
Inventory movements
Website visits
A fact table typically contains numerical values used for analysis.
Example:
Order ID | Product ID | Customer ID | Revenue |
1001 | P01 | C01 | 500 |
1002 | P02 | C02 | 300 |
Dimension Tables
Dimension tables provide descriptive information about facts.
Examples include:
Products
Customers
Regions
Dates
Employees
Example:
Product ID | Product Name | Category |
P01 | Laptop | Electronics |
P02 | Monitor | Electronics |
Dimension tables help users filter and analyze fact data.
What Is a Star Schema?
A Star Schema is the most widely recommended data modeling approach in Power BI.
In a Star Schema:
One central fact table exists.
Multiple dimension tables surround it.
Relationships connect dimensions to the fact table.
The structure resembles a star, which is where the name originates.
Example:
Fact Sales
Revenue
Quantity
Profit
Connected to:
Dim Product
Product Name
Category
Dim Customer
Customer Name
Segment
Dim Region
Region Name
Country
Dim Date
Year
Month
Quarter
Each dimension table connects directly to the central fact table.
Advantages of Star Schema
Better Performance
Power BI’s storage engine is optimized for Star Schema structures.
Reports generally load faster and process calculations more efficiently.
Easier DAX Calculations
Measures become simpler because relationships are clearly defined.
Improved Scalability
New dimensions can be added without redesigning the entire model.
Enhanced Data Quality
Duplicate values are minimized because descriptive data exists only once.
Industry Standard
Most enterprise BI solutions use Star Schema as a best practice.
For medium and large datasets, Star Schema is usually the preferred approach.
What Is a Flat Table?
A Flat Table combines all data into a single table.
Instead of creating relationships between multiple tables, all information is stored together.
Example:
Order ID | Product Name | Category | Customer Name | Region | Revenue |
1001 | Laptop | Electronics | John Smith | North | 500 |
1002 | Monitor | Electronics | Sarah Jones | South | 300 |
Every record contains both transactional and descriptive information.
This eliminates the need for relationships.
Advantages of Flat Tables
Simplicity
Beginners often find flat tables easier to understand.
There are no relationships to manage.
Faster Initial Development
Small reports can be built quickly because everything exists in one table.
Suitable for Small Datasets
For datasets with limited records, performance differences may be negligible.
Easier Data Import
Single-table imports require less preparation during initial development.
These benefits make flat tables popular among new Power BI users.
Disadvantages of Flat Tables
Despite their simplicity, flat tables have limitations.
Data Duplication
The same product, customer, or region information appears repeatedly.
This increases dataset size.
Reduced Performance
Large flat tables consume more memory and processing resources.
Difficult Maintenance
Updating business logic becomes more complex as the dataset grows.
Scalability Issues
Adding new data sources often creates additional complexity.
For enterprise reporting environments, these limitations can become significant.
Star Schema vs Flat Table
Data Structure
Star Schema uses multiple related tables.
Flat Table stores everything in one table.
Performance
Star Schema generally performs better for large datasets.
Flat Tables may slow down as data volume increases.
Maintenance
Star Schema is easier to maintain and scale.
Flat Tables become harder to manage over time.
Storage Efficiency
Star Schema reduces duplication.
Flat Tables often consume more storage.
Learning Curve
Flat Tables are easier for beginners.
Star Schema requires understanding relationships and data modeling concepts.
Enterprise Readiness
Star Schema is the industry standard for business intelligence projects.
Flat Tables are typically suitable for smaller reporting scenarios.
When Should You Use a Star Schema?
Choose a Star Schema when:
Working with large datasets
Building enterprise dashboards
Managing multiple data sources
Creating reusable data models
Developing long-term reporting solutions
Optimizing Power BI performance
Most professional Power BI projects benefit from a Star Schema approach.
When Should You Use a Flat Table?
A Flat Table may be appropriate when:
Building quick prototypes
Working with small datasets
Creating simple reports
Learning Power BI fundamentals
Managing limited reporting requirements
For small-scale projects, the simplicity of a flat table can be advantageous.
Best Practices for Power BI Data Modeling
To build effective Power BI models:
Use Star Schema whenever possible.
Create a dedicated Date table.
Avoid many-to-many relationships unless necessary.
Keep dimension tables clean and descriptive.
Remove unnecessary columns.
Use meaningful table and column names.
Create measures instead of excessive calculated columns.
Optimize data before loading into Power BI.
Following these practices improves performance, maintainability, and reporting accuracy.
Conclusion
Every effective Power BI solution starts with a solid data model. Flat tables may appear simpler at first, but as datasets get larger, they frequently cause performance and maintenance issues. In contrast, Star Schema offers a scalable and organized method that is in line with industry best standards.
Flat tables can be helpful for learning and quick improvement for novices working with tiny datasets. However, Star Schema continues to be the best option for enterprise dashboards, professional reporting, and large-scale analytics applications.
Power BI users can create faster, cleaner, and more effective reports that provide trustworthy business insights and promote long-term success by comprehending the distinctions between Star Schema and Flat Table models.
Want to Master Data Modeling in Microsoft Power BI?
Get trained by a Microsoft Certified Trainer (MCT) and learn how to build efficient Power BI data models using star schemas, relationships, and best practices for high-performance reporting.
Recommended Microsoft Power BI Certification Programs:
PL-300: Microsoft Power BI Data Analyst
DP-900: Microsoft Azure Data Fundamentals
PL-900: Microsoft Power Platform Fundamentals
DP-600: Implementing Analytics Solutions Using Microsoft Fabric
✅ Live Instructor-Led Training
✅ Star Schema & Data Modeling Best Practices
✅ Table Relationships & Data Normalization
✅ Power Query, DAX & Model Optimization
✅ Real-World Business Intelligence Projects
✅ Certification Exam Preparation & Guidance
📧 Email: trainings@debugdeploy.com
📱 WhatsApp: Contact us for quick assistance
Develop advanced Power BI data modeling skills and learn how to design scalable, high-performance semantic models that power accurate dashboards and business insights.