
Introduction
Businesses that wish to turn unstructured data into insightful knowledge now need business intelligence (BI) technologies. A dependable BI platform may help you make better decisions more quickly, whether you’re tracking sales success, keeping an eye on marketing efforts, examining consumer behavior, or creating executive dashboards.
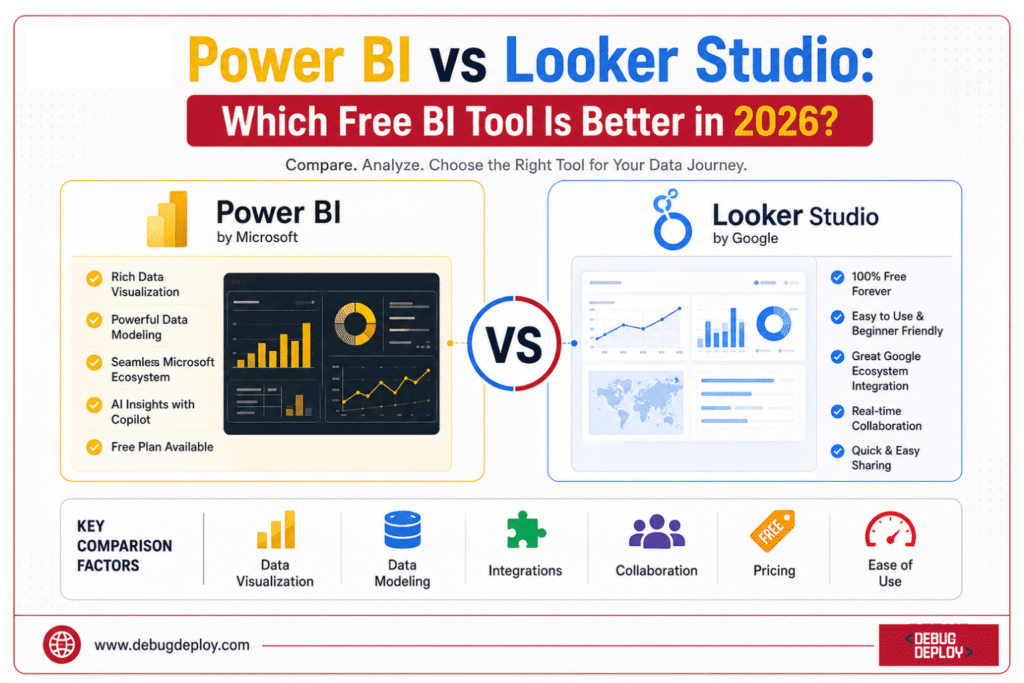
Google Looker Studio and Microsoft Power BI are two of the most widely used free BI programs available today. Connecting data sources, building interactive dashboards, and sharing reports with stakeholders are all possible with both technologies. Each platform, however, caters to distinct user preferences and corporate requirements.
As organizations continue to invest heavily in data-driven decision-making in 2026, many professionals are asking a common question:
Which free BI tool is better: Power BI or Looker Studio?
The answer depends on your business environment, data complexity, reporting requirements, and future growth plans. This guide compares both platforms across key areas to help you make an informed decision.
What Is Power BI?
Power BI is Microsoft’s business intelligence and data visualization platform designed to help organizations analyze and share insights from multiple data sources.
Power BI enables users to:
Connect to hundreds of data sources
Transform and clean data
Build interactive dashboards
Create advanced reports
Share insights across teams
Leverage AI-powered analytics
Power BI is widely used by enterprises due to its deep integration with Microsoft technologies such as Excel, Azure, Microsoft Fabric, Dynamics 365, and Microsoft 365.
What Is Looker Studio?
Looker Studio, formerly known as Google Data Studio, is Google’s free data visualization and reporting platform.
It allows users to:
Connect multiple data sources
Build visual dashboards
Share reports online
Collaborate in real time
Monitor marketing and business performance
Looker Studio is especially popular among digital marketers because of its seamless integration with Google Analytics, Google Ads, Search Console, YouTube, and BigQuery.
Ease of Use
Power BI
Power BI offers a desktop-based development environment with extensive reporting capabilities.
Advantages include:
Rich visualization options
Drag-and-drop interface
Advanced customization
Strong documentation and tutorials
However, beginners may need time to learn concepts such as data modeling, DAX formulas, and Power Query transformations.
Looker Studio
Looker Studio focuses on simplicity and quick report creation.
Benefits include:
Browser-based platform
Minimal setup required
Easy dashboard creation
Familiar Google Workspace experience
Most users can build basic reports within minutes without requiring extensive technical knowledge.
Winner: Looker Studio
For absolute beginners and marketing professionals, Looker Studio offers a gentler learning curve.
Data Connectivity
Power BI
Power BI supports hundreds of data connectors, including:
Excel
SQL Server
Azure SQL Database
SharePoint
Salesforce
SAP
Oracle
Snowflake
PostgreSQL
Microsoft Fabric
Databricks
This broad connectivity makes Power BI suitable for enterprise reporting environments.
Looker Studio
Looker Studio integrates naturally with Google’s ecosystem, including:
Google Analytics
Google Ads
BigQuery
Search Console
YouTube Analytics
Google Sheets
Additional connectors are available through third-party providers, but some advanced integrations may require paid solutions.
Winner: Power BI
Power BI provides significantly broader enterprise-grade connectivity options.
Data Modeling and Transformation
Power BI
One of Power BI’s greatest strengths is its powerful data modeling capability.
Features include:
Power Query for ETL processes
Data relationships
Star schema modeling
Calculated columns
Measures using DAX
Advanced data transformations
These capabilities allow analysts to handle large and complex datasets efficiently.

Looker Studio
Looker Studio offers basic data transformation functionality but lacks the advanced modeling capabilities available in Power BI.
Complex calculations often need to be prepared before data reaches the reporting layer.
Winner: Power BI
For serious analytics and large-scale reporting, Power BI is considerably more powerful.
Dashboard Design and Visualization
Power BI
Power BI offers:
Interactive dashboards
Drill-through reports
Custom visuals
Advanced filtering
KPI indicators
AI-powered visualizations
Users can create highly sophisticated reports suitable for executive decision-making.
Looker Studio
Looker Studio provides:
Clean visual layouts
Responsive dashboards
Easy customization
Marketing-focused templates
Real-time collaboration
Its simplicity makes dashboard development fast and efficient.
Winner: Tie
Power BI wins for advanced visualization, while Looker Studio excels in speed and simplicity.
Integration with Business Ecosystems
Power BI and Microsoft Ecosystem
Power BI integrates deeply with:
Microsoft Excel
Azure
Microsoft Fabric
Teams
SharePoint
Dynamics 365
Organizations already invested in Microsoft technologies benefit significantly from this integration.
Looker Studio and Google Ecosystem
Looker Studio works seamlessly with:
Google Analytics 4
Google Ads
Google Sheets
BigQuery
Search Console
Google Workspace
This makes it an ideal choice for digital marketing teams.
Winner: Depends on Your Environment
Microsoft-focused organizations should choose Power BI, while Google-centric teams may prefer Looker Studio.
Performance and Scalability
Power BI
Power BI is designed for enterprise workloads and can handle:
Large datasets
Complex calculations
Multi-source reporting
Enterprise-scale dashboards
Power BI also benefits from Microsoft’s cloud infrastructure and Fabric ecosystem.
Looker Studio
Looker Studio performs well for lightweight reporting and marketing dashboards. However, performance can decline when working with extremely large datasets or complex reports.
Winner: Power BI
Power BI offers better scalability for growing businesses and enterprise environments.
AI and Advanced Analytics
Power BI
Microsoft has invested heavily in AI capabilities.
Features include:
AI-powered insights
Natural language queries
Predictive analytics
Automated anomaly detection
Copilot integration
Microsoft Fabric AI experiences
These capabilities help organizations uncover insights without requiring deep data science expertise.
Looker Studio
Looker Studio focuses primarily on visualization and reporting. While it can connect to AI-powered Google services, advanced analytics functionality is more limited within the platform itself.
Winner: Power BI
Power BI clearly leads in AI-driven analytics.
Collaboration and Sharing
Power BI
Power BI allows users to:
Publish reports
Share dashboards
Manage permissions
Create workspaces
Collaborate securely
Some advanced sharing features require Power BI Pro licensing.
Looker Studio
Looker Studio follows a Google Docs-style sharing model.
Users can:
Share links instantly
Collaborate in real time
Control permissions
Embed reports easily
Winner: Looker Studio
For simple collaboration and sharing, Looker Studio is often more convenient.
Pricing Considerations
Power BI
Power BI Desktop is free, making it an excellent option for learning and individual analysis.
Organizations typically require:
Power BI Pro
Power BI Premium
Microsoft Fabric capacity
for advanced collaboration and enterprise deployment.
Looker Studio
Looker Studio remains free for most reporting needs, making it highly attractive for startups, freelancers, agencies, and small businesses.
Winner: Looker Studio
For completely free reporting and sharing, Looker Studio offers excellent value.
Which Tool Should You Choose in 2026?
Choose Power BI If:
You work in a Microsoft environment
You need advanced analytics
You manage large datasets
You require enterprise reporting
You want AI-powered insights
You plan to build a career in data analytics
Choose Looker Studio If:
You focus on digital marketing reporting
You primarily use Google products
You need fast dashboard creation
You want easy report sharing
You have limited technical experience
You need a completely free solution
Future Outlook
Both platforms are still developing quickly.
Microsoft is presenting Power BI as a comprehensive enterprise intelligence platform by making significant investments in it through Microsoft Fabric, Copilot, and AI-driven analytics.
With more robust connectors, cloud analytics features, and closer linkages to BigQuery and Google AI services, Google keeps improving Looker Studio.
Depending on organizational needs, both tools will continue to be useful choices as companies embrace data-driven strategies.
Conclusion
Although they cater to different populations, Power BI and Looker Studio are two of the most potent free BI products accessible in 2026.
Looker Studio is excellent in terms of ease of use, teamwork, and marketing analytics. For businesses that depend significantly on Google products and require rapid, easily accessible reporting, it is perfect.
In contrast, Power BI provides better data modeling, sophisticated analytics, enterprise scalability, AI capabilities, and more integration choices. Power BI offers a more complete platform for professionals looking to advance their careers in business intelligence, data analytics, and corporate reporting over the long term.
Looker Studio is a great option if you want to report quickly and for free. Power BI is still the better choice if you require enterprise-level analytics and sophisticated business intelligence features.
In the end, the ideal BI tool is the one that fits your company’s data strategy, technical needs, and expansion goals.
Want to Build Powerful Business Intelligence Skills With Microsoft Power BI?
Get trained by a Microsoft Certified Trainer (MCT) and master Power BI to transform business data into interactive dashboards and actionable insights.
Recommended Microsoft Power BI Certification Programs:
PL-300: Microsoft Power BI Data Analyst
DP-900: Microsoft Azure Data Fundamentals
PL-900: Microsoft Power Platform Fundamentals
DP-600: Implementing Analytics Solutions Using Microsoft Fabric
✅ Live Instructor-Led Training
✅ Interactive Dashboards & Data Visualization
✅ Power Query, DAX & Data Modeling Skills
✅ Business Intelligence Reporting Best Practices
✅ Microsoft Fabric & Power BI Integration
✅ Certification Exam Preparation & Guidance
📧 Email: trainings@debugdeploy.com
📱 WhatsApp: Contact us for quick assistance
Build job-ready Power BI skills and learn how to create professional dashboards, analyze business data, and deliver impactful insights with Microsoft's leading BI platform.